Dashboards Available on Home Page |
|

| Dashboard | View | Description |
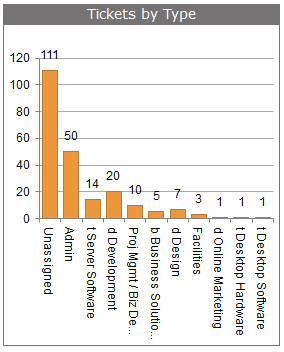
| Open Tickets by Type |
|
Displays the number of current open (or on hold) tickets associated with each Ticket Type (top level). Each segment can be clicked on to view those tickets in particular as a list or to refresh the chart for the subtypes of that ticket type.
Options: Show unassigned (can choose to include all tickets without a ticket type).
|
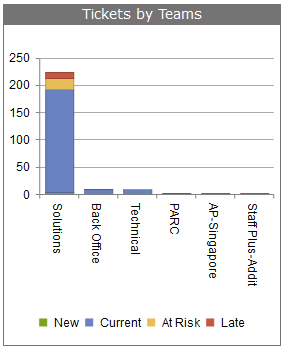
| Open Tickets by Team |
|
This chart displays the number of current open (or on hold) tickets that are assigned to each team. Choose to break down each segment by new/good/risk/late tickets.
Options: Show by state (not on pie chart).
|
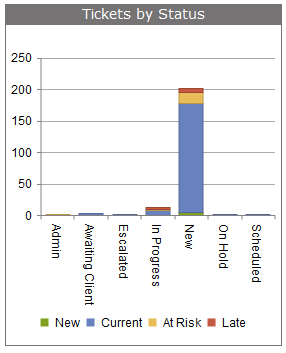
| Open Tickets by Status |
|
This chart displays the number of current open (or on hold) tickets that are assigned to each status (not closed or emptied). Choose to break down each segment by new/good/risk/late tickets.
Options: show by state (not on pie chart). |
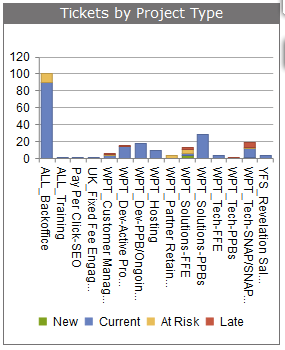
| Open Tickets by Project Type |
|
This chart displays the number of current open (or on hold) tickets that are assigned to projects in each project type. Choose to break down each segment by new/good/risk/late tickets.
Options: Show by state (not on pie chart). |
| Open Tickets by State |
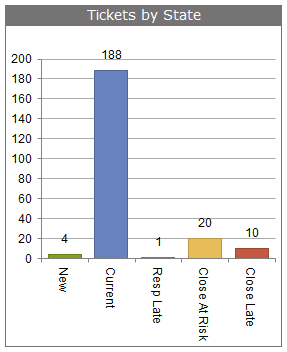
|
This chart displays the number of current open (or on hold) tickets that are currently in each ticket state.
|
| Open Tickets by Group |
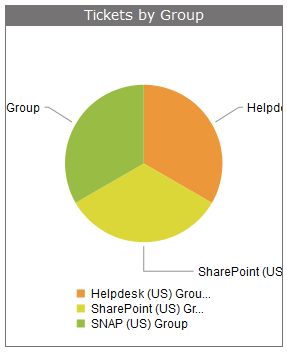
|
This chart displays the number of current open (or on hold) tickets that are assigned to groups or queues.
Options: Show by state (not on pie chart). |
| Open Tickets by Client |
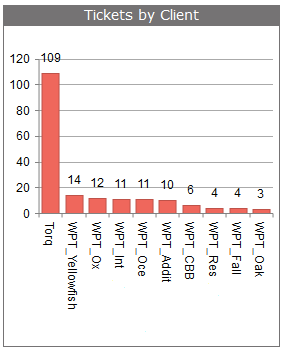
|
Displays the number of current open (or on hold) tickets by client.
|
| Open Tickets by Priority |
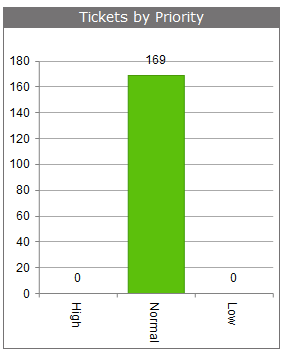
|
You can either see results for all priority sets or set the chart to show only one.
Option: Choose priority set.
|
| Open Tickets by Office |
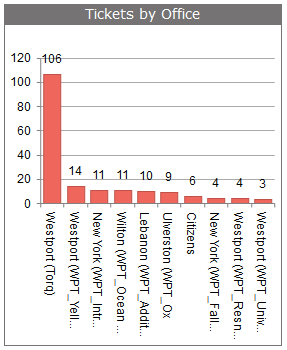
|
This chart displays the number of current open (or on hold) tickets by each office of each client.
|
| Open Tickets by Source |
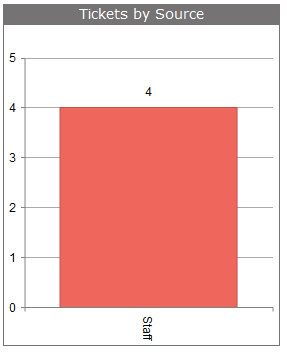
|
This chart displays the number of current open (or on hold) tickets by how they were logged into the system (by staff, email parser, self-service interface, ticket template, recurring template, outlook bridge, web service/API, mobile, chat, quick ticket (SSI)).
Options: Select when tickets were opened (today, this week/month/quarter, last month, YTD, custom date range, last X days).
|
| Top Users |
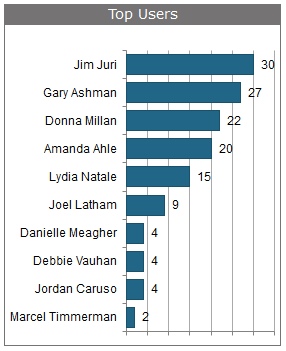
|
This chart displays the people with the most number of tickets associated with them.
Options: This chart can be configured to report on a desired number of end users or ticket assignees either by ticket volume or the amount of time logged in each ticket. The names can display as full or first name only.
|
| Top Clients |
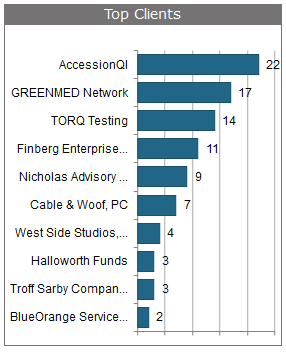
|
This chart will display the clients with the most number of tickets associated with them.
Options: This chart can be configured to report on a desired number of ticket either by ticket volume or the amount of time logged in each ticket. |
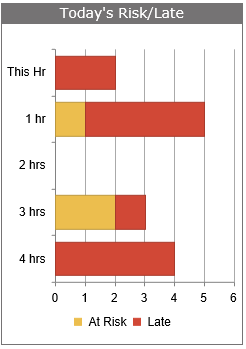
| Today's Risk/Late |
|
This chart will display the number of tickets that are currently not in a risk or late state that will change to either risk or late in each hour period from now.
|
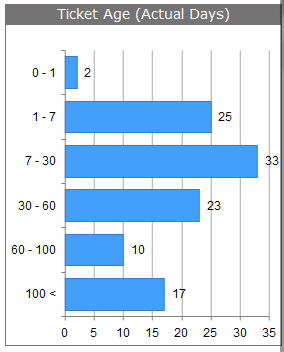
| Ticket Age |
|
This chart will display the number of tickets that fall into anywhere from two to six definable age ranges of minutes, hours, days or months of either actual time or available working time (based on how you have defined your working hours in Revelation).
|
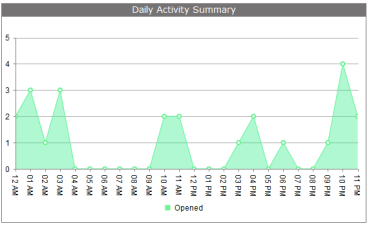
| Daily Activity Summary |
|
This chart displays the number of tickets logged into the system within each hour period in a representative day. The chart can display data on the tickets opened today, this week/month, last month, this quarter, YTD, any custom date range or across the last X number of days. |
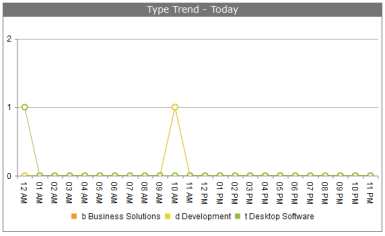
| Type Trend |
|
This chart tracks the number of tickets logged into the system by ticket type across the course of a day, week, month, custom date range, or in the past X number of days. The data can be confined to your pre-defined working hours only. You have the option to show tickets with no ticket type (unassigned).
|
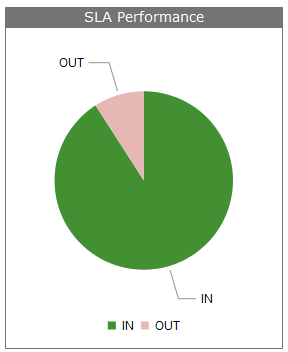
| SLA Performance |
|
This presents the number of tickets that are currently within or outside of their SLA. It can report on either Response SLA or Resolve SLA. The chart can be configured to report on tickets that are due today, this week/month, last month, this quarter, YTD, any custom date range or across the last X number of days.
|
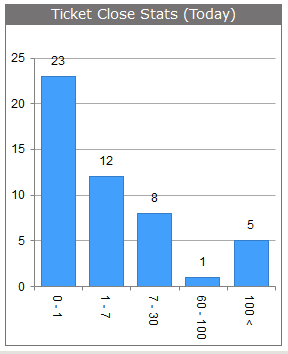
| Ticket Close Statistics |
|
This chart presents the number of tickets closed in up to six different configurable ranges of minutes, hours, days or months. This time can be measured in total time passed or be confined to only those hours within your pre-defined work hours. |


